Articles
Counting Elliott Waves (Elliott Wave Tutorial: Part I)
In this four-part tutorial you’ll learn about the theory and applications of the Elliott wave. In part I, you’ll learn about projections. This tutorial, while by no means a definitive text on Elliott wave (EW) theory, is instead meant to be an overview of the basic elements that can serve as a foundation for further study. Altogether, the four parts will serve as a helpful reference as you do your own analysis. Throughout the tutorial, most wave patterns will be shown in rising (bull) markets, since similar principles can be applied to falling (bear) markets. Wave labels that would normally be circled will instead be enclosed in brackets in text.
WHY USE ELLIOTT WAVES?
The goal of any system is to identify market lows and buying opportunities (or short covering) and market highs and selling opportunities (or short selling). Elliott wave analysis can help you accomplish these goals, and will keep you in the market and going in the right direction.
Early technician Ralph Nelson Elliott observed that crowd behavior trended and reversed in recognizable patterns. Further, he discovered that stock market price action revealed a similar repetitive nature. Elliott isolated nine patterns of movement, or “waves,” that recur in the constantly changing market, and are repetitive in form. He named, defined, and illustrated these patterns, and then described how the structures link to form larger versions of the same patterns. In a nutshell, the wave principle is a catalog of price patterns and an explanation of where these forms are likely to occur in overall market development. These descriptions were first published in a booklet called The Wave Principle in the mid-1930s. Later, Elliott incorporated his theories into a larger work entitled Nature’s Law, in which he introduced the Fibonacci relationships that are integral to wave analysis.
WAVE IDENTIFICATION
Identifying the wave level (degree) your tradable is in at any given time is crucial to projecting where you are going. Figure 1 lists the nine levels that Elliott defined, and the labels that were assigned to these levels by A.J. Frost and Robert R. Prechter in their Elliott Wave Principle, a widely recognized textbook in EW studies. These labels are now accepted standards, and can be found in many EW software programs available today.
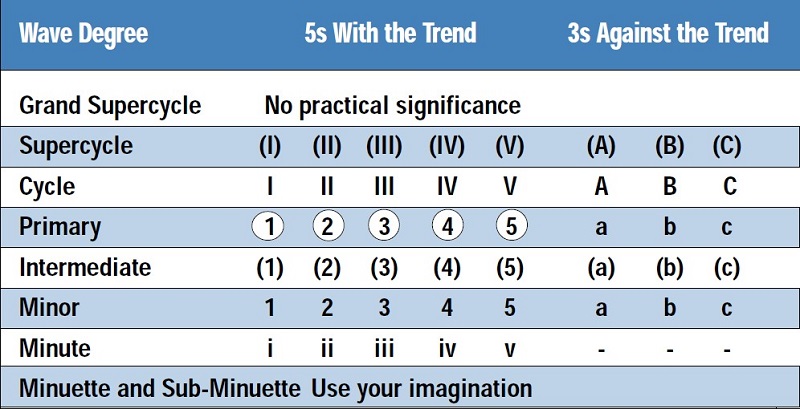
FIGURE 1: ELLIOTT WAVE LEVELS AND LABELS. These schemes are recommended for labeling waves.
One of the biggest problems that newcomers to EW analysis have is grasping the structure or “nesting” of the wave patterns (Figure 1). I have found it helpful to liken this hierarchy to others you may be familiar with, such as the levels of directories in Windows folders, which have become known to users as parent, child, and grandchild. Using this analogy, from the table in Figure 1 it is easy to see that the primary wave is child to the cycle wave, and the intermediate wave is both child to the primary and parent to the minor, while the minor is grandchild to the primary. These waves within waves are referred to as subwaves, or waves of a lesser degree.’
In this tutorial I will only be discussing the minor, intermediate, and primary waves. This is all that is necessary to understand wave action, since every action and reaction of one wave level is the same at other levels. All price projections in EW theory are based upon Fibonacci ratios and retracements. However, these are not required for an understanding of wave theory, and so will be covered in depth in part IV, which will concentrate on EW trading.
ELLIOTT WAVE PRINCIPLES
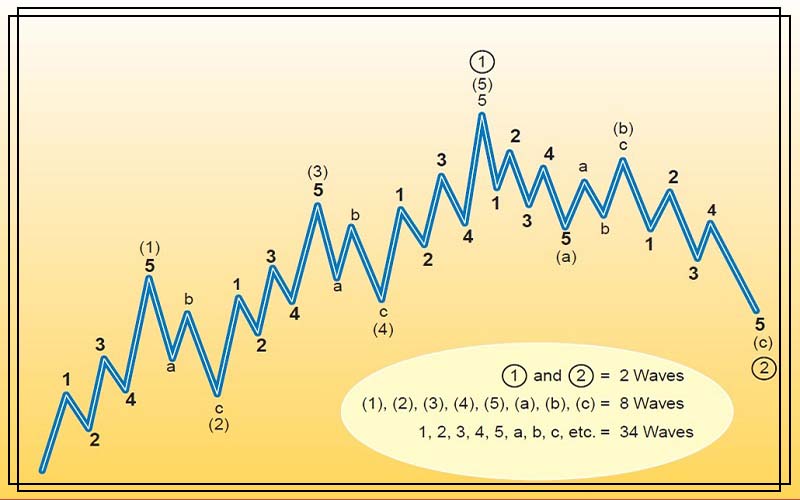
An intermediate wave cycle is shown in Figure 2 and consists of a five-wave motive (forward trend) wave (1), and a three-wave corrective (countertrend) wave (2). Waves 1 to 5 and A to C are minor waves, the building blocks of this hierarchy. The motive or impulse wave consists of three waves in the direction of the trend, labeled W1, W3, and W5, and two corrective waves in the opposite direction, W2 and W4. The corrective waves W2 and W4 have a Fibonacci relationship to W1 and W3, respectively. Waves W3 and W5, however, are not retracements but ratios or percentages of all preceding waves. This relationship is the crux of projecting successive wave price. It is helpful to keep these relationships in mind when studying the wave theories.
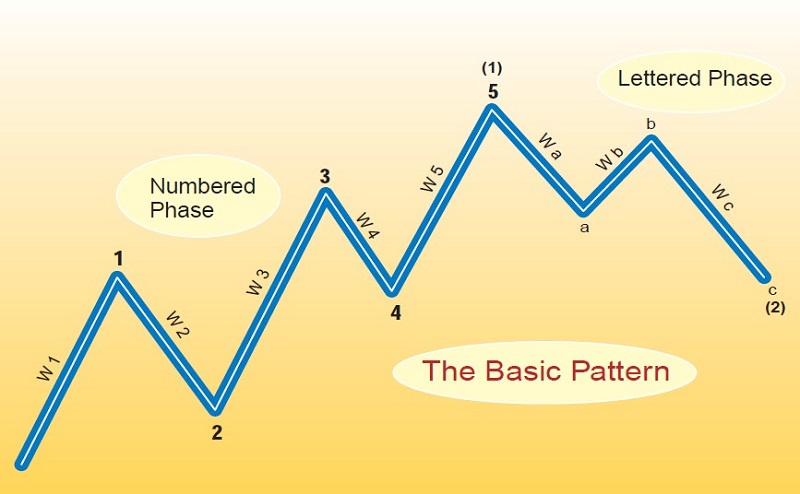
FIGURE 2: INTERMEDIATE WAVE CYCLE. Here, you see a five-wave motive wave labeled as (1) and a three-wave corrective wave labeled as (2).
WAVE DESCRIPTIONS
A motive or impulse wave is a wave moving in the direction of the trend. Thus, a bear wave in a bear market is a motive wave. Each motive wave W1, W3, and W5, at whatever level, is made up of five motive waves of one lesser degree. The two corrective waves are countertrend waves, always in the direction opposing the trend. Consider them pauses in the major trend — the retracement that you should expect following an advance. The pattern of waves 2 and 4 is exactly like the ABC waves of wave (2). This is a “generic” corrective wave. Each of these waves has many patterns, some quite complex (covered in detail in part II). In a corrective wave, waves A and C are motive (in the direction of the countertrend that opposes the main trend) and wave B is corrective (a countertrend). Because they are motive waves, waves A and C are five-wave patterns. Wave B, being corrective, is a three-wave pattern.
Figure 3 shows a primary wave cycle, which illustrates this wave/subwave structure. The intermediate pattern of Figure 2 is merely the first eight waves of the pattern in Figure 3. Similarly, the 34 waves of Figure 3 are merely the first two primary waves, [1] and [2], of a cycle pattern.
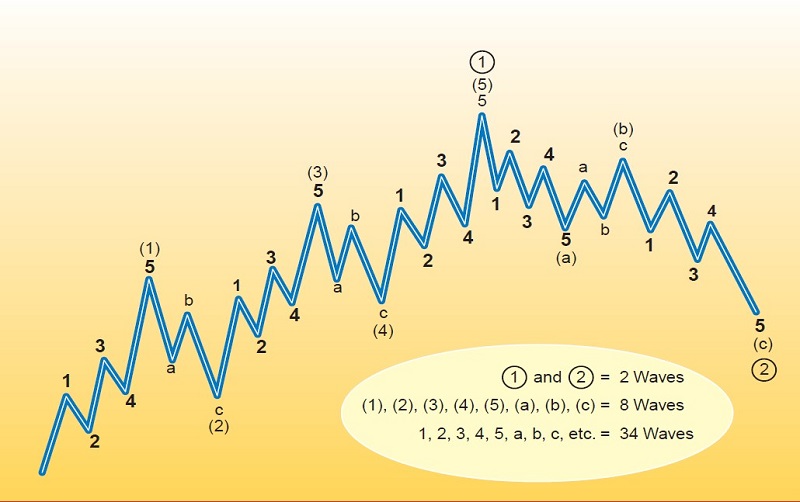
FIGURE 3: PRIMARY WAVE CYCLE. This is a representation of the wave/subwave structure of Elliott wave patterns.
Without going into the details of the exact ratios and retracements that are used to project future price targets, I’ll discuss the procedure to be used in applying EW analysis to a stock or index. End-of-day charts will be sufficient to identify minor waves and higher. Real-time five-minute charts may be required to see details of minute and minuette waves. Not one but several Fibonacci ratios are used in projecting future waves from current waves. The general rules are:
- W2 is a retracement of W1
- W3 is a combination of a ratio of W1 and W2
- W4 is a combination of a retracement of W3 and ratios of W1 through W3
- W5 is a combination of ratios of W1 through W4.
By combination, I mean that there will be projections of future prices from ratios, and projections from retracements. The highest reliability for projections can be found by determining all probabilities based upon all possible retracements and ratios to arrive at a cluster of numbers, several of which will be so close that they assure the most probable wave end. For example, the W5 projection will produce numbers from the ratios of W1, W2, W3, W4, and the entire length of W1 through W4. These calculations can be done easily using a spreadsheet program.
PROCEDURE
Try to project the price at which the next reversal will occur. If you’re in a motive wave and you are long, you are looking for the price at which to sell and go short, because the market will reverse at some point (since the next wave will be corrective and a countertrend). This is the price at which you should close your long position, sell short, write covered calls, and/or buy puts, if you’re so inclined. Once this wave is under way, you will want to project the next price reversal, where you will cover your shorts and go long. This procedure should be repeated for each projected reversal, since your objective is to always be in the market in the right direction.
You can remain long for an entire motive wave duration, and remain short for an entire corrective wave duration. However, there are many opportunities within these waves for you to switch your bull/bear hat. In a motive wave there will be five reversals (three motive and two corrective), and in a corrective wave there will be three reversals (two motive and one corrective). In addition, within each of the five submotive waves of the higher motive wave there will be three motive waves and two corrective waves. Fortunately, every reversal is another buy/sell opportunity.
There are only three inviolate rules in EW analysis, although there are many guidelines. These rules are:
- Wave 3 cannot be shorter than both waves 1 and 5
- Wave 2 cannot retrace below the beginning of wave 1
- Wave 4 cannot retrace into wave 1’s price.
Frost and Prechter warn that a wrong wave count will lead to erroneous projections. If you believe you are in wave 4, for example, and it retraces into the price range of wave 1, what you were assuming were waves 3 and 4 are more likely to be subwaves 1 and 2 of a wave 3 in development.
In part II, I will describe the various wave patterns you must recognize to determine where you are in a given wave— the name of the game is pattern recognition. In part III, I will discuss channels, a method of projecting waves graphically rather than mathematically. However, this is not as precise as using ratios and retracements, so in part IV I will provide detailed descriptions of wave analysis necessary for “trading” the waves.
Rudy Teseo has taught courses in options trading and the basics of stock charting.
